

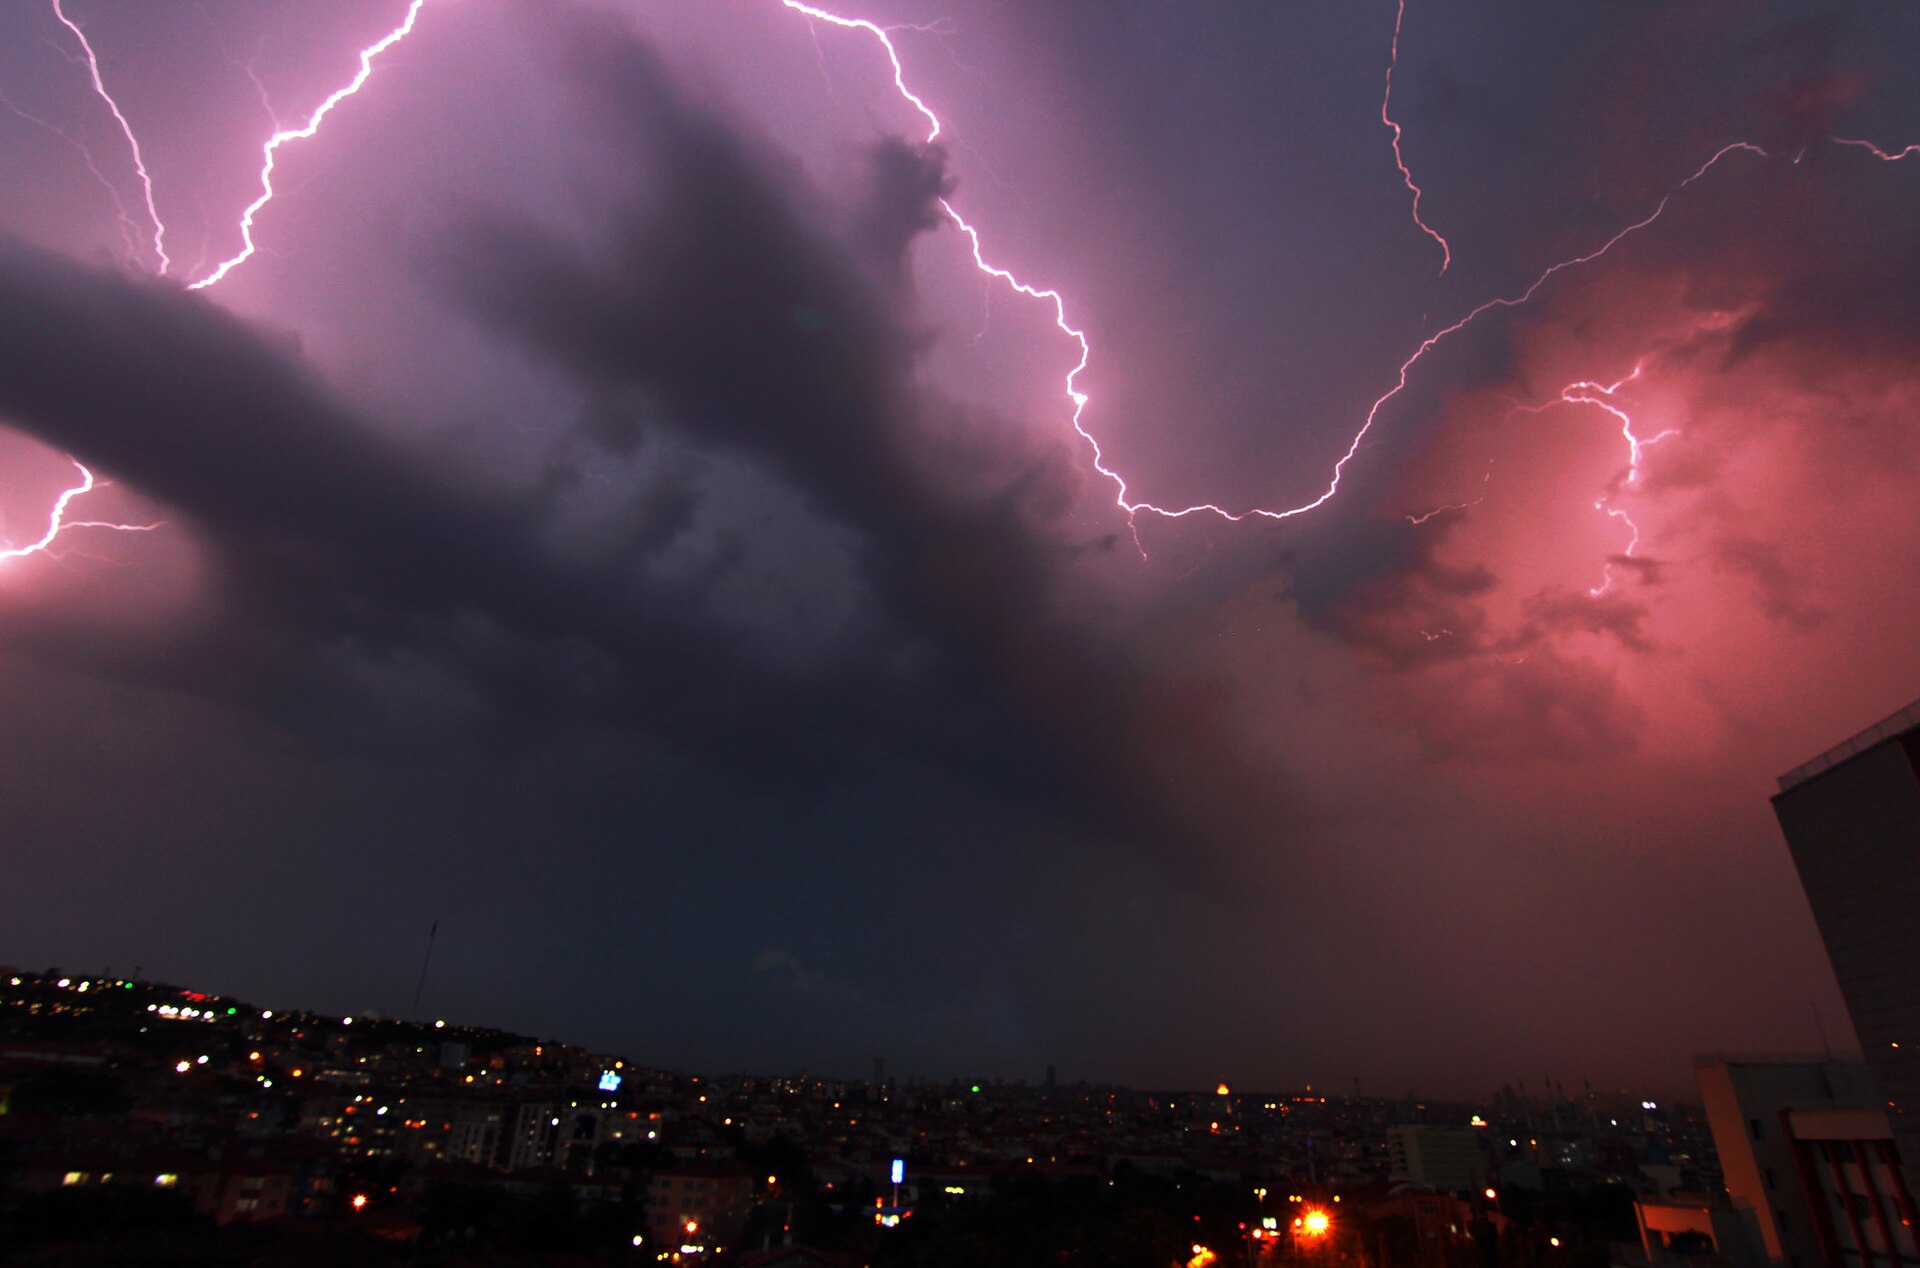
Every summer now seems to bring the same grim montage: flooded streets, wildfire smoke turning skies orange, and heat records falling in places that once considered such temperatures impossible. It is natural to ask whether the weather really is getting more extreme, or whether smartphones and rolling news simply make it feel that way. The honest answer, drawn from decades of temperature gauges, rain gauges, tide gauges and satellite records, is that several kinds of extreme weather are measurably changing — though not all of them, and not everywhere in the same way.
That distinction matters. At News Headlines Daily we try to separate the signal from the noise, because the data tells a more interesting story than either complacency or panic. Some trends are strong and consistent across continents. Others are patchy, regional, or tangled up in natural variability. Understanding which is which is the starting point for sensible decisions about homes, infrastructure and emergency planning.
What counts as an extreme event?
Scientists usually define an extreme event statistically: a temperature, rainfall total or wind speed that ranks among the rarest few per cent for that place and season. A heatwave in Canada is not measured against the same baseline as one in India, because ecosystems and infrastructure adapt to local norms. This local framing explains why a temperature that seems mild in one region can cause chaos in another, where buildings, railways and hospitals were designed for a cooler past.
The key international assessments, including the reports of the Intergovernmental Panel on Climate Change, compare today’s extremes against a pre-industrial baseline. That long view strips out year-to-year luck and reveals whether the underlying distribution of weather itself is shifting.
The clearest signal is heat
On heat, the evidence is about as settled as climate science gets. Hot extremes have become more frequent and more intense over most land areas since the 1950s, while cold extremes have become milder. Land is warming faster than the oceans, and each fraction of a degree of global warming makes what used to be a rare heat event noticeably more likely. The World Meteorological Organization has confirmed a string of record global temperatures in recent years, with significant heatwaves affecting every inhabited continent.
Heavy rainfall shows a related pattern. Warmer air can hold more moisture — roughly seven per cent more for every degree of warming — so when storms do form, they tend to wring out more rain in a short time. That helps explain why flash flooding is rising in many regions even where total annual rainfall has changed little.
Where the picture is more mixed
Not every hazard follows the global script. Drought depends on rainfall, evaporation, soil and land use all at once, so trends differ sharply between regions. Tropical cyclones show no clear long-term change in overall numbers, though a larger share appear to reach the strongest categories, and they are dumping more rain. Tornado records are dominated by better reporting, which makes firm trend claims difficult to support.
Natural variability also still matters enormously. El Niño and La Niña swing weather patterns across the Pacific and far beyond, and a single season can buck the long-term trend in any one place. Good analysis holds both truths at once: the background risk is shifting, while individual events still have individual causes.
What the data means in practice
For planners, the message is practical rather than abstract. Drainage designed for yesterday’s rainfall, building codes written for yesterday’s heat, and flood maps based on last century’s rivers increasingly underestimate today’s risk. Insurers have noticed, repricing cover in exposed regions. Households notice too, in everything from water restrictions to the rising cost of keeping a home cool through a long summer.
The records will keep accumulating, and attribution science — which estimates how much human influence changed the odds of a specific event — is getting faster and sharper. In our latest coverage of the science behind the headlines, the data, rather than the drama, remains the story worth following.
